September 2022 Housing Market Outlook
Posted on Oct 04, 2022
Houwzer's Market Outlook is based on the questions we continue to receive from clients, employees,...

Posted on Oct 04, 2022
Houwzer's Market Outlook is based on the questions we continue to receive from clients, employees, and investors about the implications for the housing and mortgage markets in which we are active.
There’s been a lot of media focus lately on home price declines. Yes, home prices are declining month-over-month in most markets. However, that is actually normal and expected this time of year due to the seasonality of the real estate market.
What is not being widely reported is that housing prices are still significantly up year-over-year in all of the markets we monitor (ranging from 3.88% in the DC region to 16.13% in Tampa Bay, compared to last fall).
And this is happening despite rapidly deteriorating fundamentals!
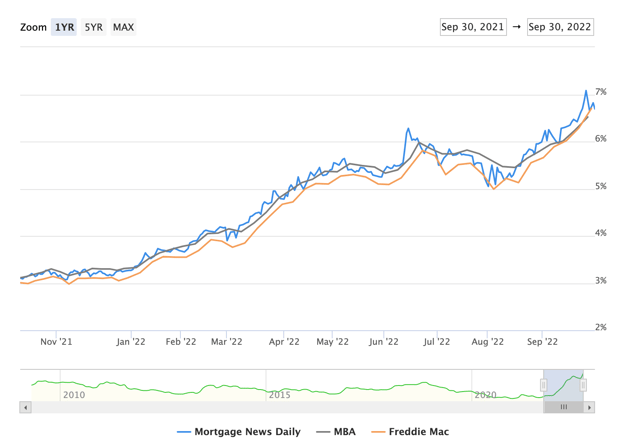
We’ve gone from roughly 3% mortgage rates to 7% mortgage rates in a year, while inventory, days on market, and the number of deals going under contract have all worsened considerably. Yet housing prices are still up versus this time last year.
So: when will house prices finally fall on a seasonally-adjusted basis?
Shockingly, it does not seem likely that we will see a year-over-year housing price decline in 2022. In Fall 2021, we observed a normal seasonal pattern of home price declines at the end of the year. Though prices are now declining month over month, the decline is too mild for us to see year-over-year decline in any of the remaining months of 2022.
However, Spring 2022 opened with a major bang and we reached what we (one month prematurely) predicted might be a market top this June. It’s unlikely (barring major changes in mortgage interest rates between now and then) that we reach June 2022 home prices in June 2023.
Our call right now: if current trends continue, we will finally see a year-over-year decline in home prices in Q1 or Q2 of next year.
However, if the Fed decides to stop hiking rates - or even opts to decrease rates - it’s possible we might not see home prices decline on an annualized basis at all! This is a real possibility, given that the Fed is facing external pressure to let up their hawkishness. If we have to draw a line in the sand and make a prediction, we'll likely see that decline in March 2023.
As far as when the bottom will be: it will depend on how long the Fed stays in their current anti-inflation posture. Because of fundamental supply and demand mismatches due to a national housing shortage, as soon as the Fed changes their outlook, we believe the housing market will continue its inexorable long term price appreciation.
So if you are a prospective buyer waiting for a true, seasonally-adjusted pullback in prices, you might have a very short window (or even none at all, if the Fed reverses course during the winter months).
Below is the granular market data for September 2022 in the markets we currently serve:

Subscribe to our newsletter to get essential real estate insights.
Posted on Oct 04, 2022
Houwzer's Market Outlook is based on the questions we continue to receive from clients, employees,...
Posted on Oct 04, 2022
Houwzer's Market Outlook is based on the questions we continue to receive from clients, employees,...

Posted on Oct 04, 2022
Houwzer's Market Outlook is based on the questions we continue to receive from clients, employees,...