Summer 2022 Housing Market Outlook
Posted on Sep 08, 2022
Houwzer's Market Outlook is based on the questions we continue to receive from clients, employees,...
Posted on Sep 08, 2022
Houwzer's Market Outlook is based on the questions we continue to receive from clients, employees, and investors about the implications for the housing and mortgage markets in which we are active. See August's outlook.
There’s been a lot of media speculation over the past few months that we are in a housing recession, correction, or even “crash” induced by rapid increases in mortgage rates. These increases have certainly changed the dynamics of the housing market - we are now building inventory month over month in each of our five markets.
However, we still have yet to see a year-over-year nominal sales price decline (though year-over-year home price appreciation has failed to outpace inflation in our Mid-Atlantic markets).
Furthermore, US median home prices across the board are up a massive 33% versus the pre-pandemic market in Q3 2019. In the largest home price crash on record in 2007-2009, US median home prices only declined around 21%.
Even if we saw an event of that magnitude happen again in 2023 (which nearly everyone agrees is unlikely to happen, due to tightened credit standards/regulations), home prices would still have appreciated 12% over a 4-year period. That's about 3% per year, or just below the long term average appreciation rate for housing of around 4%.
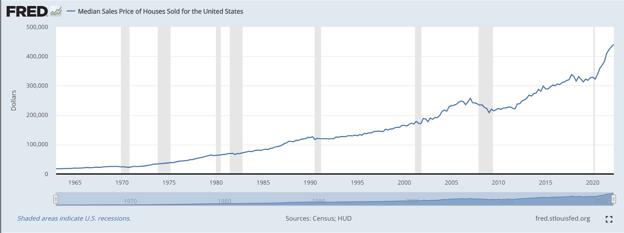
So, if you’re one of those people waiting for the “crash” to buy, you should be aware that not only are we are exceedingly unlikely to see 2019 home prices ever again (it would require a housing market crash over 50% more severe than the great Recession), but also that it’s not even guaranteed that we will see 2020 (or even 2021) home prices again, even in the face of increasing inventory.
Though it's possible that 2023 or even 2024 home prices will be lower than 2022’s, there is never a guarantee – and timing the market is exceedingly difficult.
All of that being said, things are certainly slowing. After a brief respite, average 30-year fixed mortgage rates have crept back up over 6% which is driving serious affordability challenges for buyers, especially when coupled with still significant year-over-year home price increases. Because of this we expect the trend of fewer homes going under agreement vs. this time last year, and year-over-year inventory increases to continue if interest rates stay at their current levels.
In every market, the average sales price to original list price has dropped - the average seller has had to come down a bit on their listing price, and over-asking offers are receding further in the rearview mirror as a common occurrence. A buyer's market isn't here yet, but buyers are regaining their foothold in price negotiations.
Barring a major macroeconomic or Fed policy shift, we expect this slow march toward at least a less-strong sellers’ market to continue unabated.
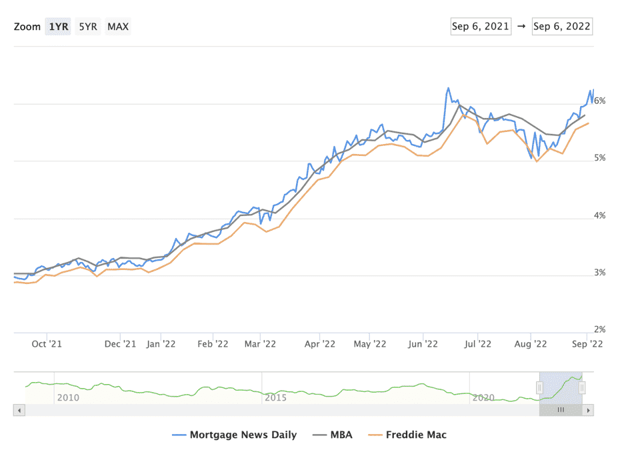
Source:Mortgage News Daily
Below is the granular market data for August in the markets we currently serve.

Subscribe to our newsletter to get essential real estate insights.
Posted on Sep 08, 2022
Houwzer's Market Outlook is based on the questions we continue to receive from clients, employees,...

Posted on Sep 08, 2022
Houwzer's Market Outlook is based on the questions we continue to receive from clients, employees,...
Posted on Sep 08, 2022
Houwzer's Market Outlook is based on the questions we continue to receive from clients, employees,...