
Philly Regional Q3 Housing Report: Strong Sales Volume, Low Inventories, and Flattening Prices Persist
Posted on Feb 02, 2021
Houwzer’s Senior Economic Advisor, Dr. Kevin Gillen, has released his Q3 housing market report for...

Posted on Feb 02, 2021

February 1, 2021: Houwzer’s senior Economic Advisor, Dr. Kevin Gillen, has released his 2020 Q4 report for the Washington DC housing market. In it, he notes that the end of 2020 saw the regional housing market surge forward and even break several new records:
The lack of inventory and high demand has created a hot market for homes, and home prices have been climbing steadily despite the ongoing disruption of COVID-19. The regional house price index reached a new all-time high and inventory levels dropped to an all-time low. In Northwest DC, the median house price crossed the $1 million threshold for the very first time. Check out the numbers:
Inventory: The number of homes available for sale in the region fell from 13,793 at the beginning of 2020 to 12,398 by the end of 2020. This is the first time that inventory has fallen below 13,000 dwellings. At the current pace of sales, there is only a 1.8 months’ supply of inventory; the industry considers 5-7 months’ supply to be typical of a “balanced” market.
Home sales: The number of homes for sale, however, hasn’t actually abated. Homes are simply getting sold and leaving the market incredibly quickly. By the end of 2020, 55,010 houses changed hands across the DC region, with 4,958 of them being in the District. This was up nearly 17% and 8.3%, respectively, from 47,044 and 4,580 transactions in 2019.
Housing Prices: House prices showed significant gains across the region in 2020, and the pace of those gains also accelerated throughout the year. By the time 2020 ended, the general level of home prices in the region had risen 10.7% from where they started at the beginning of the year. The median house price in the Washington DC metro area increased from $527,000 to $575,000 over the last twelve months; an increase of 9.1%.
The price index pushed past its previous peak in 2006 and set a new all-time high record. Besides such a landmark being indicative of a strong market, it also has another meaningful implication: almost all of the housing wealth that was destroyed with the collapse of the previous housing bubble and subsequent Great Recession has now been recovered. And the future still looks bright: Zillow upgraded their price forecast for the area again this quarter, predicting that the general level of house prices in the DC region will increase by 8.6% over the next 12 months, instead of the 5.1% gains it previously forecasted.
What does this mean for buyers?
The market in this region shows no sign of softening, home prices are expected to continue their climb faster than previously expected, and the current low interest rates aren’t going to last forever, so buyers shouldn’t plan on waiting for a lull period. Those who'd like to purchase in the near future should be prepared to move quickly when they find a home. Focus on getting pre-approved and having finances in order, identify non-negotiables ahead of time, and hire an agent who can handle the tough negotiating.
What does this mean for sellers?
The dramatically low supply of inventory and record high house prices means that there’s probably never been a better time to sell your home. Buyers have fewer options to choose from, yet face strong competition. In addition, many households that—for years—have been in a negative equity position are no longer so constrained, and hence are free to sell their house without fear that its market value is insufficient to settle their outstanding mortgage. Something else to keep in mind: if a significant number of sellers decide to cash in on the current market high, that could lead to the market softening a bit. All signs point toward 2021 being a good year for sellers, either way.
The recent confluence of low interest rates, exceptionally low inventories and the increased importance on housing caused by remote working not only made 2020 an exceptionally robust year for housing in the DC region, but one in which a particularly major threshold was crossed: the increase in house prices at the end of 2020 was sufficient to push the region’s house price index past its previous peak that was achieved back in 2006 to a new all-time high:
Washington D.C. Metro Area House Price Index 1980-2020:
1980Q1=100
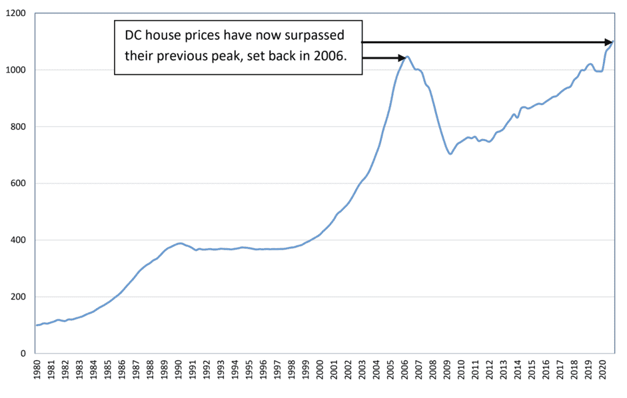
Besides such a landmark being indicative of a strong market, it also has another meaningful implication: almost all of the housing wealth that was destroyed with the collapse of the previous housing bubble and subsequent Great Recession has now been recovered. Many households that—for years—have been in a negative equity position are no longer so constrained, and hence are free to sell their house without fear that its market value is insufficient to settle their outstanding mortgage. However, while such positive sentiment may suggest continued bullishness for the region’s housing market, a significant increase in listings would have the opposite effect, and exert downward pressure on house prices. Which outcome will prevail is worth watching out for.
--------
1 As measured by the DC metro area house price index computed for and used in this report.
2 Months’ Supply of Inventory is how many months it would take for the current inventory of homes listed for sale, given the current pace of sales. 5-7 months is generally considered by the industry to be typical of a balanced market.

Subscribe to our newsletter to get essential real estate insights.
Posted on Feb 02, 2021
Houwzer’s Senior Economic Advisor, Dr. Kevin Gillen, has released his Q3 housing market report for...
Posted on Feb 02, 2021
Houwzer’s Senior Economic Advisor, Dr. Kevin Gillen, has released his Q2 housing market report for...

Posted on Feb 02, 2021
Houwzer’s Senior Economic Advisor, Kevin Gillen, has released the Q1 housing market report for the...